How I Set Up Observability for Claude Code with the Grafana Stack
AI coding assistants are becoming standard engineering tools. But here’s a question most teams aren’t asking yet: how much are they actually costing us, and are they making us faster?
I spent a morning wiring up Claude Code’s built-in OpenTelemetry support to our existing Grafana stack (Alloy, Mimir, Loki). No new infrastructure. No vendor lock-in. Just environment variables and a small collector config.
Here’s what I learned.
Claude Code Already Speaks OpenTelemetry
This surprised me. Claude Code ships with native OTEL support — no SDK wrappers, no sidecar, no code changes. You set a few environment variables and it starts emitting metrics and log events.
The metrics are genuinely useful:
- Token usage per model (input, output, cache read, cache creation)
- Cost in USD per session and model
- Lines of code added and removed
- Commits and PRs created
- Tool accept/reject decisions — how often engineers trust the AI’s suggestions
- Active time — actual usage vs. idle
The log events capture per-request details: latency, model used, token counts, API errors, and tool execution results.
The Architecture
If you run a Grafana stack, you already have everything you need.
Claude Code (developer laptop)
        │
        │  OTLP/HTTP
        ▼
   Grafana Alloy  (lightweight collector)
        │
        ├── metrics → Mimir
        ├── logs    → Loki
        └── traces  → Tempo
Alloy acts as the OTLP receiver and fans out each signal type to the right backend. About 300 MHz CPU and 256 MB RAM — negligible if you already run it for other workloads.
Developer Setup
On the developer’s machine, add this to ~/.claude/settings.json:
{
  "env": {
    "CLAUDE_CODE_ENABLE_TELEMETRY": "1",
    "OTEL_METRICS_EXPORTER": "otlp",
    "OTEL_LOGS_EXPORTER": "otlp",
    "OTEL_EXPORTER_OTLP_PROTOCOL": "http/protobuf",
    "OTEL_EXPORTER_OTLP_ENDPOINT": "http://your-alloy-host:4318",
    "OTEL_EXPORTER_OTLP_METRICS_TEMPORALITY_PREFERENCE": "cumulative",
    "OTEL_RESOURCE_ATTRIBUTES": "team.id=your-team,user.name=your-name"
  }
}
That last line about temporality preference? I wasted 30 minutes debugging why metrics weren’t showing up in Mimir. Claude Code defaults to delta temporality. The Prometheus remote write exporter in Alloy silently drops delta sums. No errors, no warnings at info level. You only see dropped unsupported delta sum if you crank Alloy to debug logging. Set it to cumulative and everything flows.
The Alloy Pipeline
A minimal River configuration receives OTLP, enriches with a source label, and routes signals:
// OTLP Receiver
otelcol.receiver.otlp "claude_code" {
  http {
    endpoint = "0.0.0.0:4318"
  }
  output {
    metrics = [otelcol.processor.attributes.claude_code.input]
    logs    = [otelcol.processor.attributes.claude_code.input]
  }
}

// Enrich with source label
otelcol.processor.attributes "claude_code" {
  action {
    key    = "source"
    value  = "claude-code"
    action = "upsert"
  }
  output {
    metrics = [otelcol.processor.filter.claude_code.input]
    logs    = [otelcol.exporter.loki.claude_code.input]
  }
}

// Only forward claude_code.* metrics
otelcol.processor.filter "claude_code" {
  metrics {
    include {
      match_type = "regexp"
      metric_names = ["claude_code\\..*"]
    }
  }
  output {
    metrics = [otelcol.exporter.prometheus.claude_code.input]
  }
}

// Mimir via Prometheus remote write
otelcol.exporter.prometheus "claude_code" {
  forward_to = [prometheus.remote_write.mimir.receiver]
}

prometheus.remote_write "mimir" {
  endpoint {
    url = "http://mimir:9009/api/v1/push"
  }
}

// Loki
otelcol.exporter.loki "claude_code" {
  forward_to = [loki.write.default.receiver]
}

loki.write "default" {
  endpoint {
    url = "http://loki:3100/loki/api/v1/push"
  }
}
If you’re on Mimir 2.16+ or Grafana Cloud, you can skip the Prometheus conversion and use otelcol.exporter.otlphttp for metrics too.
Alternative: OTel Collector YAML
If you already run a standalone OTel Collector instead of Alloy:
receivers:
  otlp:
    protocols:
      http:
        endpoint: 0.0.0.0:4318

processors:
  attributes/claude:
    actions:
      - key: source
        value: claude-code
        action: upsert
  filter/claude_metrics:
    metrics:
      include:
        match_type: regexp
        metric_names:
          - "claude_code\\..*"

exporters:
  prometheusremotewrite:
    endpoint: "http://mimir:9009/api/v1/push"
  loki:
    endpoint: "http://loki:3100/loki/api/v1/push"

service:
  pipelines:
    metrics:
      receivers: [otlp]
      processors: [attributes/claude, filter/claude_metrics]
      exporters: [prometheusremotewrite]
    logs:
      receivers: [otlp]
      processors: [attributes/claude]
      exporters: [loki]
What You Can Actually See
Once data flows, here’s what the dashboard looks like in practice.
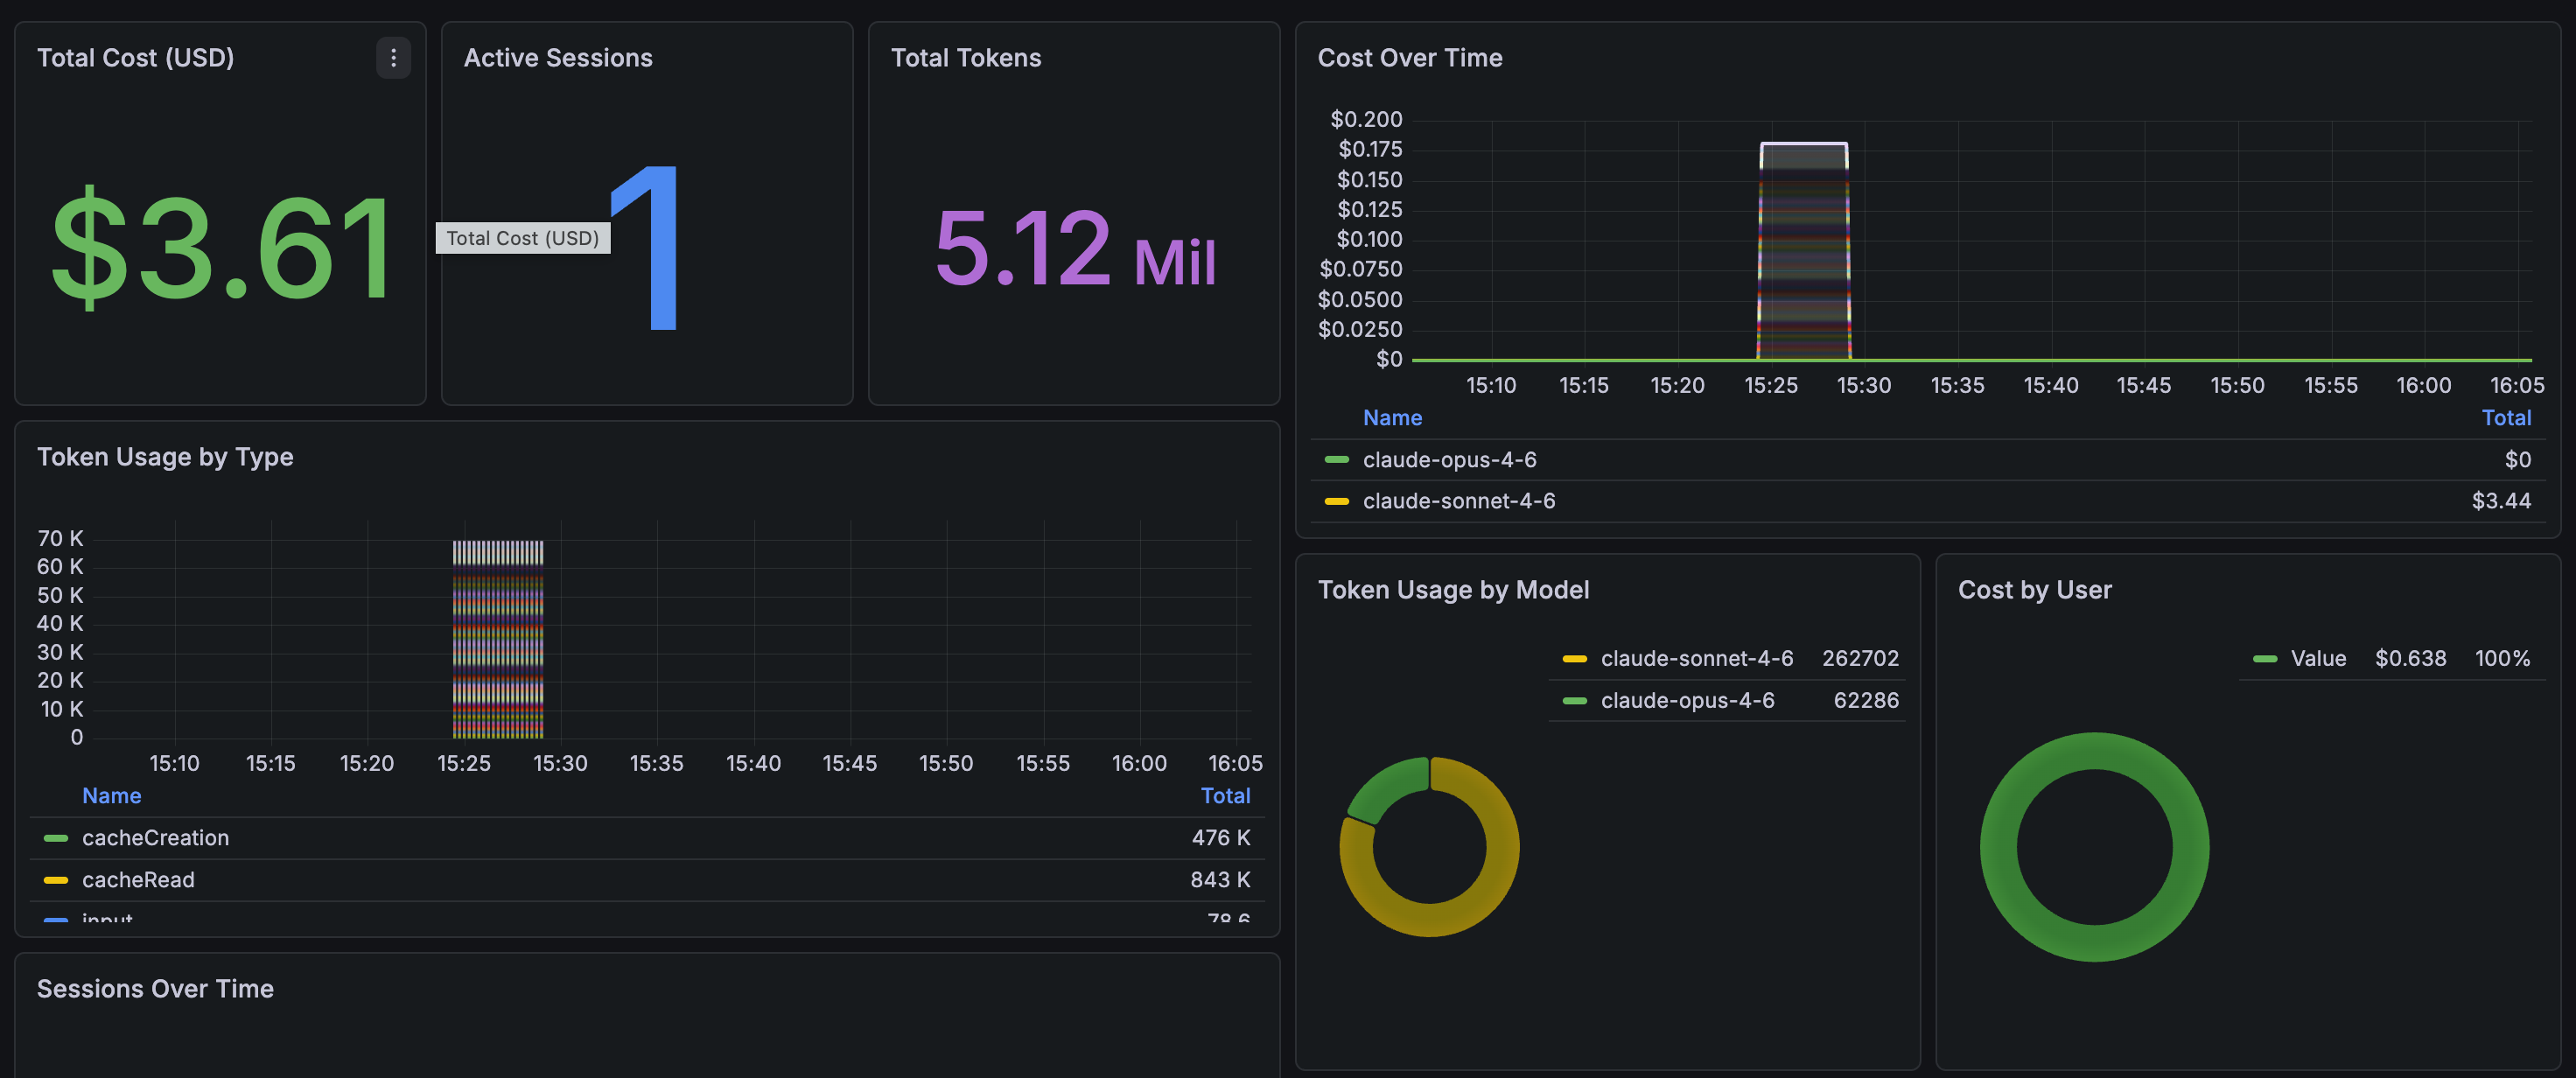
The overview row gives you the headline numbers — total cost, active sessions, token consumption, and cost broken down by model:
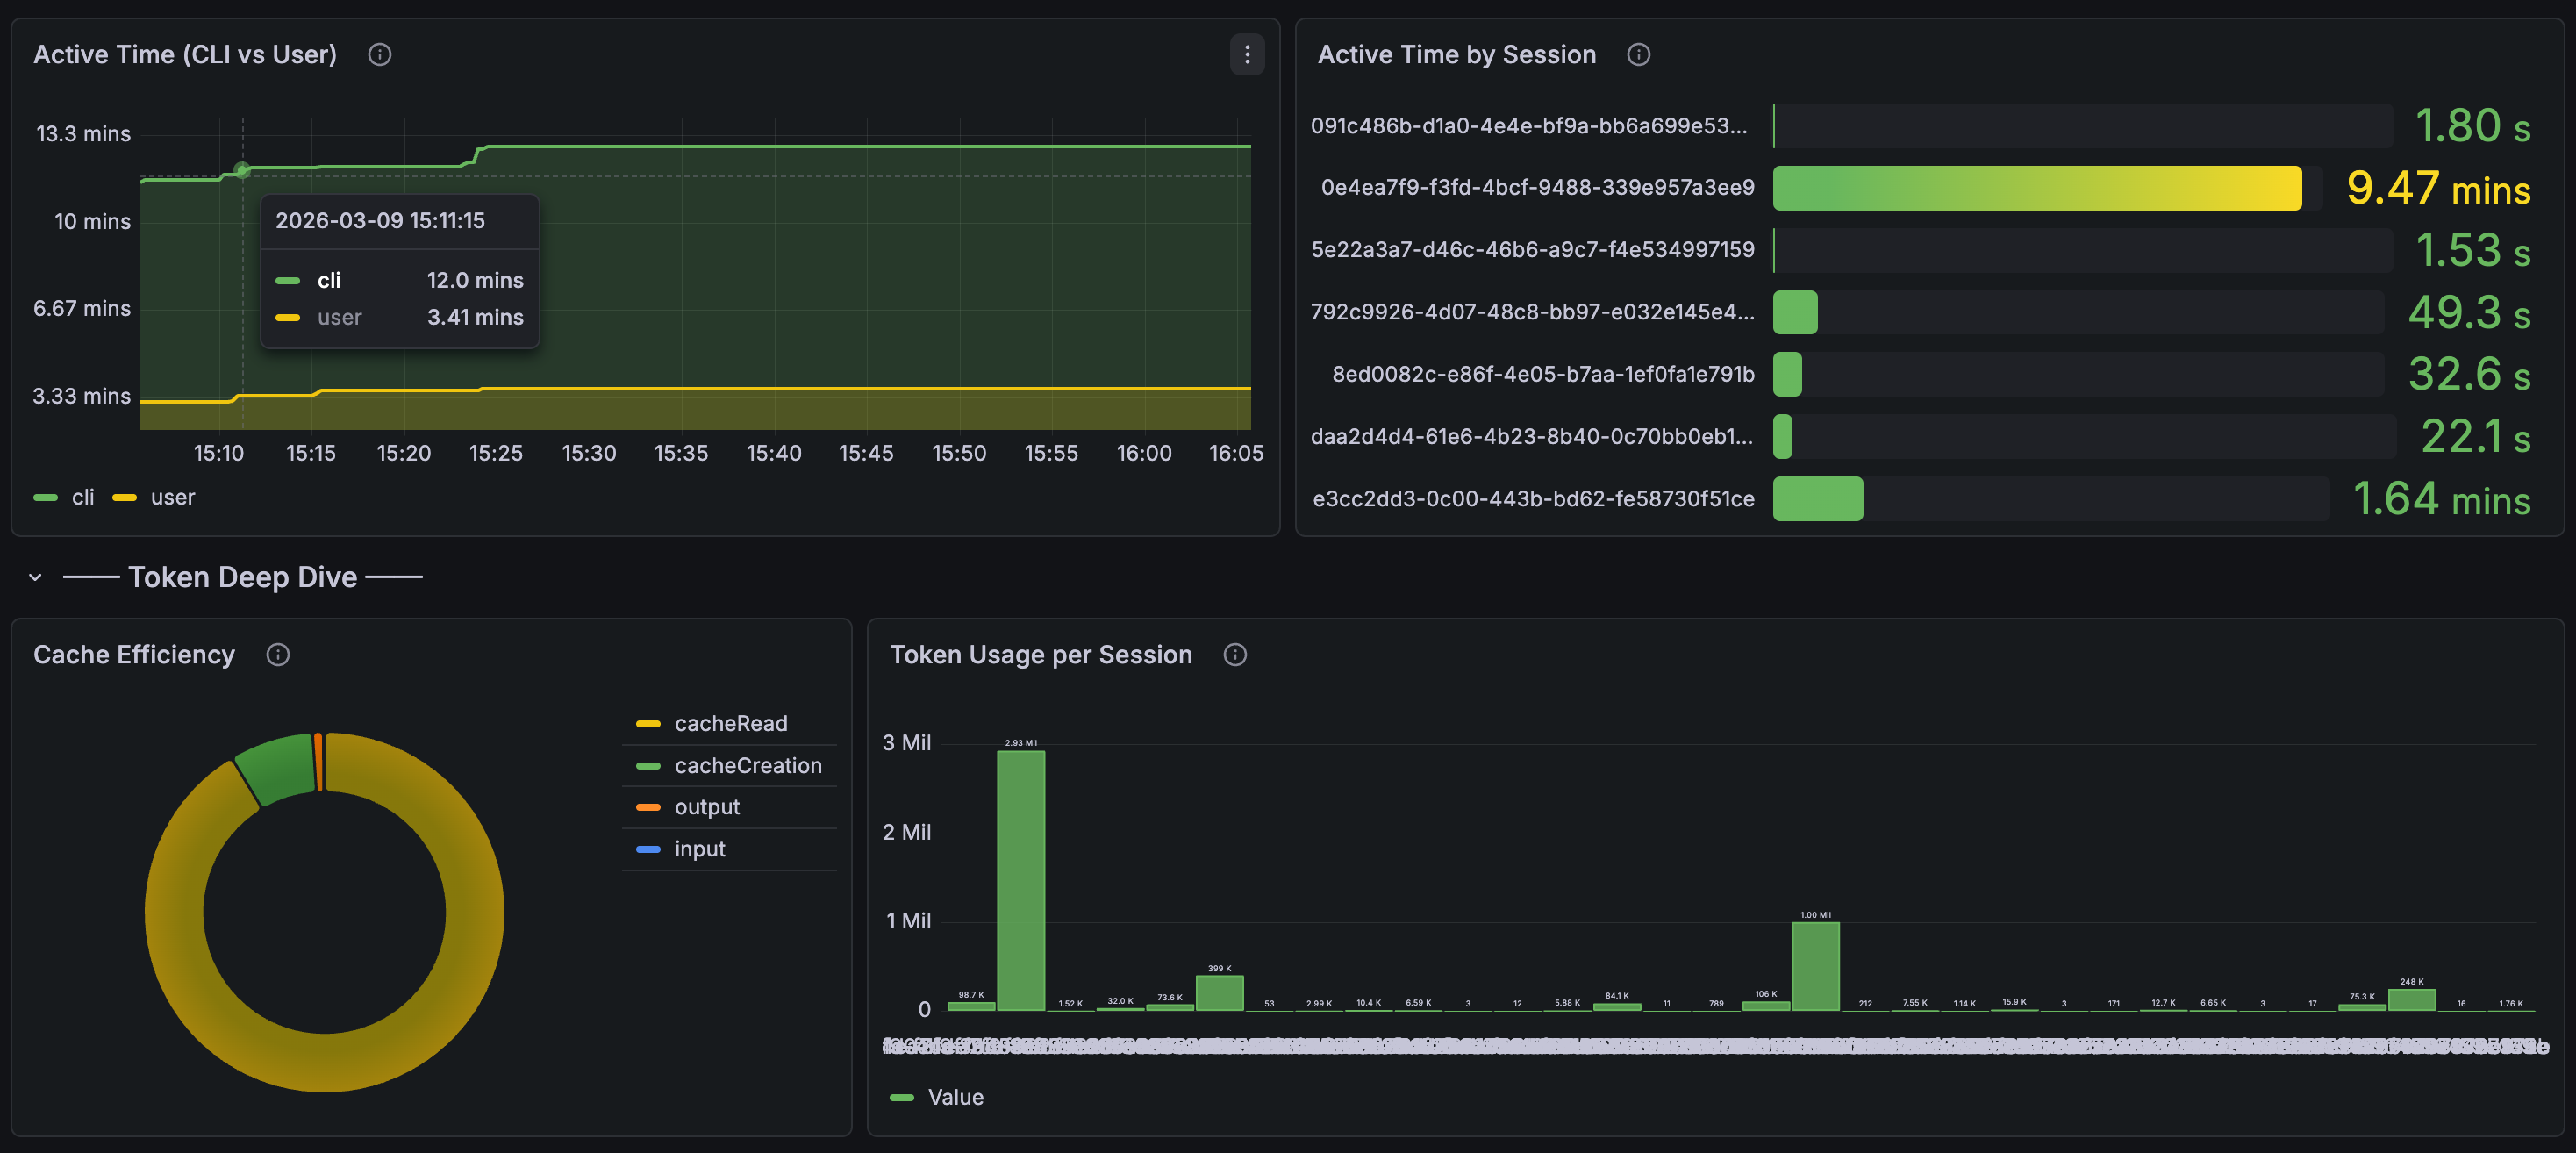
Drill into session activity and cache efficiency. The active time panel shows CLI vs. user think time, and you can see token usage per individual session:
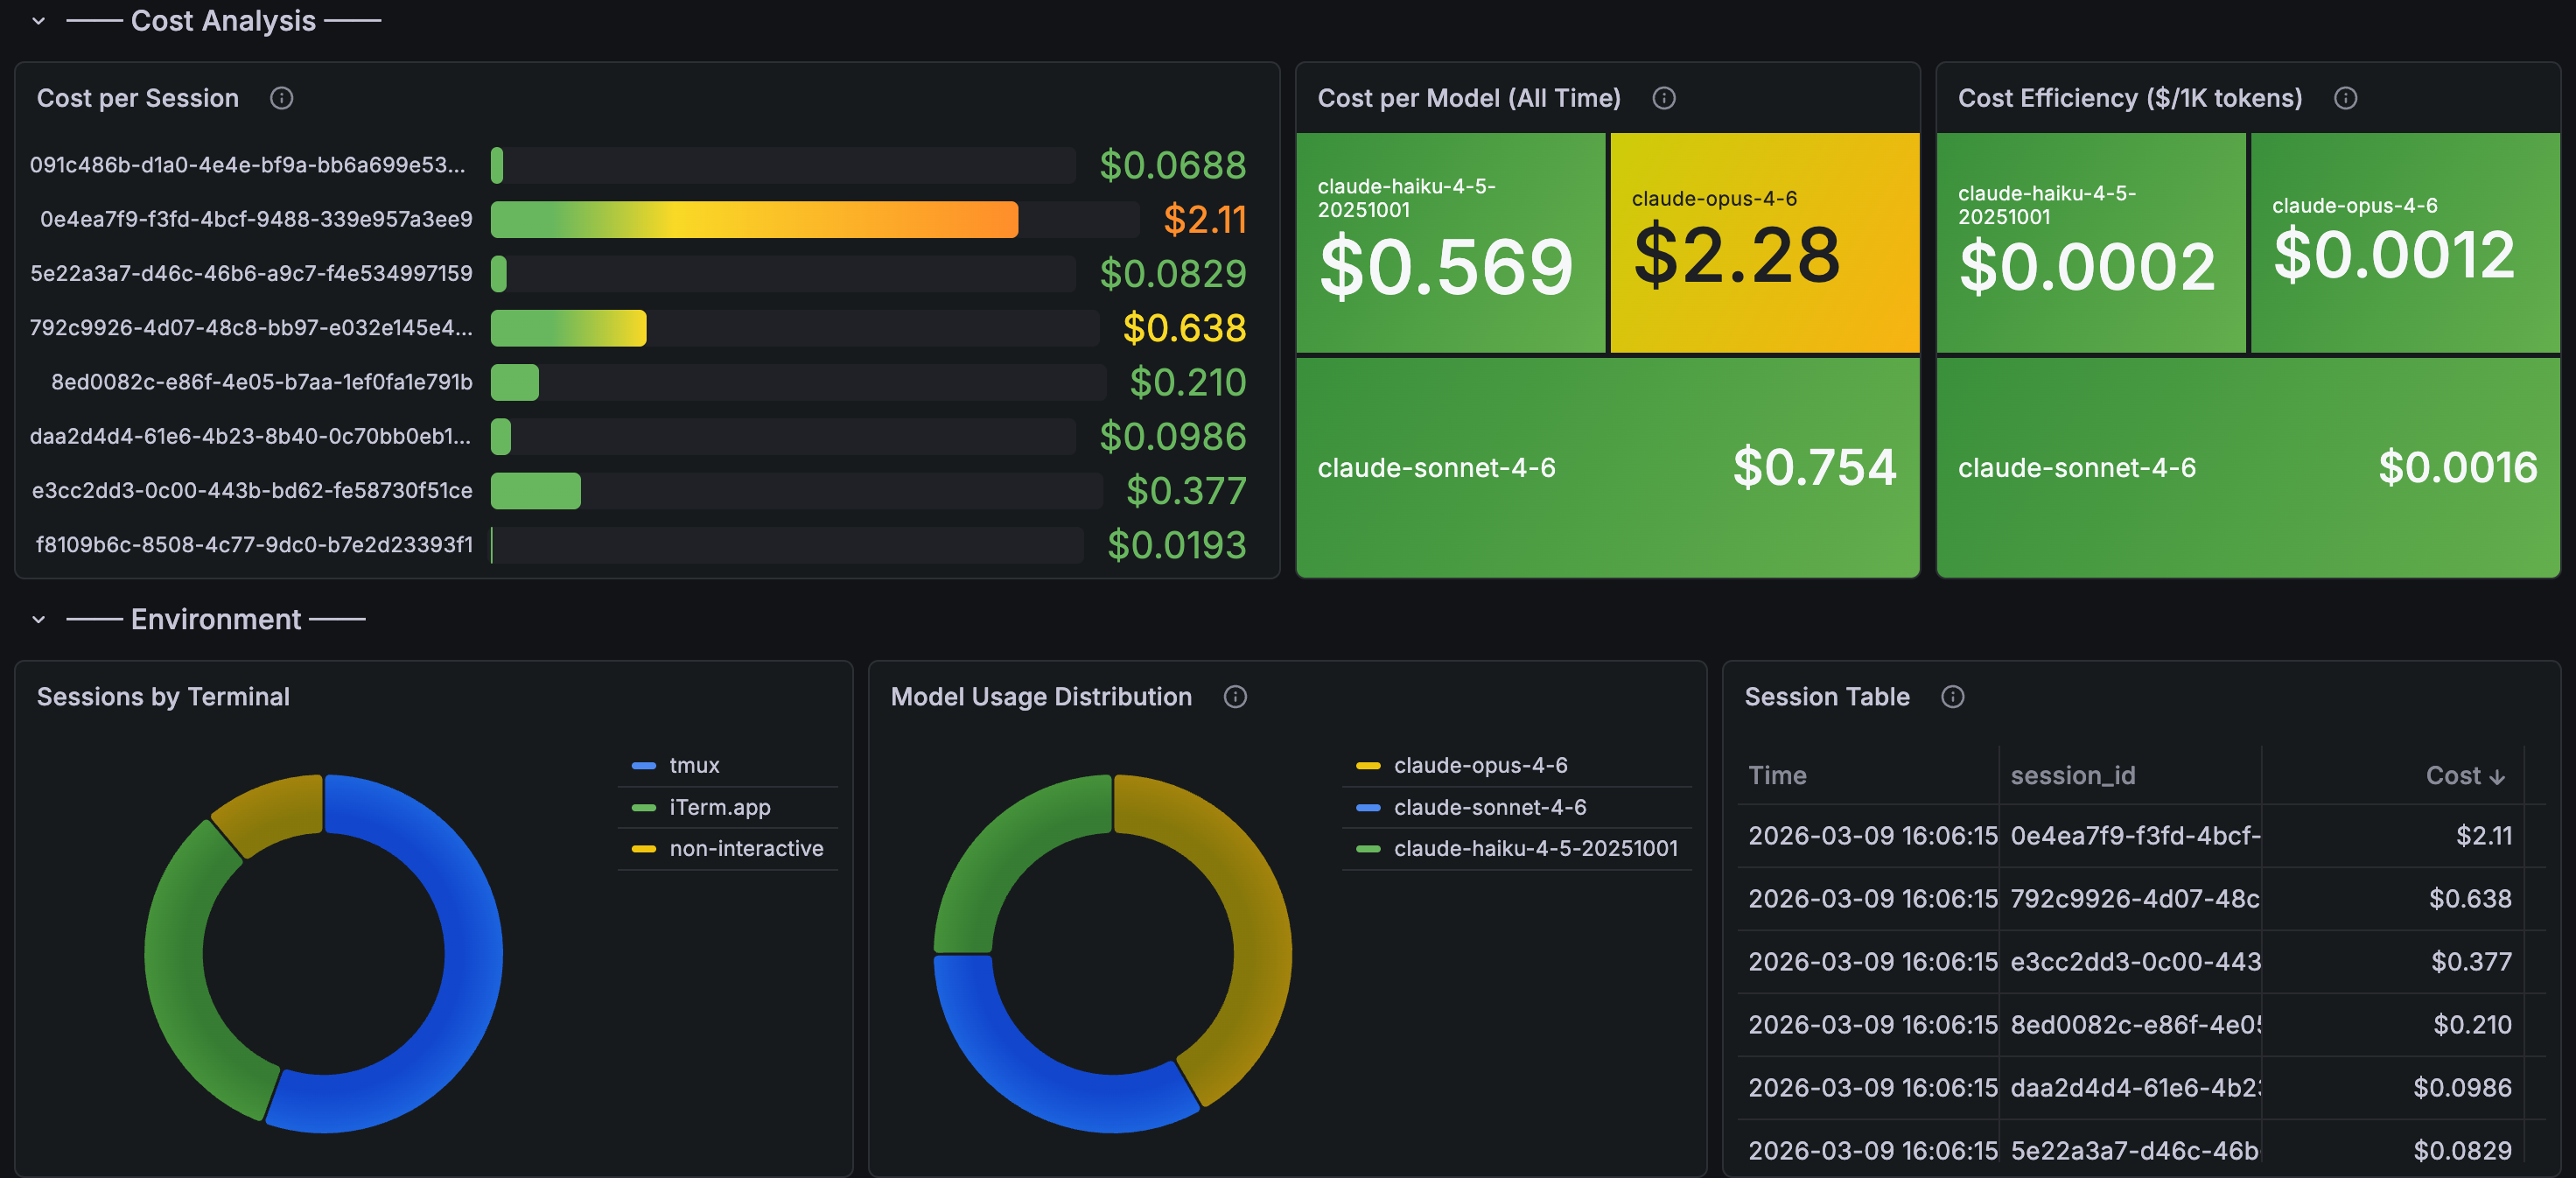
The cost analysis section is where it gets interesting for managers — cost per session, cost per model, cost efficiency ($/1K tokens), and a session table sorted by spend:
With these panels in place, you get answers to questions that matter:
Cost governance: Total USD spent on Claude Code per team, per engineer, per week. Set alerts before someone accidentally runs a loop that burns $50/hour.
Productivity signal: Are the teams using AI coding tools shipping more code? Correlate claude_code_lines_of_code_count and claude_code_commit_count with your deployment frequency.
Quality signal: The tool accept/reject metric (claude_code_code_edit_tool_decision) tells you something interesting. High rejection rates might mean the tool is struggling with a particular codebase, or an engineer needs guidance on how to prompt effectively.
API reliability: Track claude_code_api_error events. If Anthropic’s API has a bad day, you’ll see it in your dashboards before your engineers start complaining in Slack.
Alerting
Once the data is in Mimir and Loki, standard Grafana alerting rules work:
groups:
  - name: claude-code
    rules:
      - alert: HighCostSpike
        expr: sum(increase(claude_code_cost_usage_total[1h])) > 50
        for: 5m
        labels:
          severity: warning
        annotations:
          summary: "Claude Code cost spike: >$50/hour"

      - alert: HighTokenBurn
        expr: sum(rate(claude_code_token_usage_total[5m])) > 100000
        for: 10m
        labels:
          severity: info
        annotations:
          summary: "Sustained high token usage (>100k tokens/5min)"
The cost alert is the important one. AI API costs can spike fast when agents get stuck in loops. You want to know about it before the invoice arrives.
A Gotcha Worth Knowing
Claude Code’s -p flag (one-shot prompt mode) runs too briefly for the OTEL exporter to flush. Telemetry only works reliably in interactive sessions or longer-running processes. If you’re testing and see no data, that’s probably why.
Tuning Variables
A few env vars worth knowing:
| Variable | Default | Notes |
|---|---|---|
OTEL_METRIC_EXPORT_INTERVAL |
60000 | Lower to 10000 for debugging |
OTEL_LOG_USER_PROMPTS |
disabled | Keep disabled — privacy |
OTEL_LOG_TOOL_DETAILS |
disabled | Enable for debugging |
OTEL_METRICS_INCLUDE_SESSION_ID |
true | Set false in prod to reduce cardinality |
The Bigger Picture
This is table stakes for any organization rolling out AI coding tools. You wouldn’t deploy a microservice without metrics and logging. Why would you deploy an AI assistant that consumes API tokens at scale without the same visibility?
The data also feeds into something I’ve been thinking about: an “Agent Readiness” score for repositories. Repos with better documentation, tests, and structure produce better AI output. Now you can actually measure it — correlate readiness scores with agent task completion rates and cost efficiency.
We already measure engineering with DORA metrics. AI agent observability is the next layer.